

Ten red warnings in a speed report do not necessarily mean ten equally urgent jobs. Are visitors waiting for a product image, struggling with a menu or getting stuck before they can request a quote? Improving website performance starts with locating the delay in the task someone is trying to complete.
Website performance covers loading, responsiveness and visual stability during use. A polished page still falls short if it keeps people waiting. Fast, reliable interactions belong in the practical work of web design and usability.
1. Choose the Page and User Task to Investigate
Testing the homepage is a starting point, not a site-wide verdict. Product pages, service pages, listings and quote forms may load different resources and run different code. Select journeys visitors actually use: finding a product, changing an option, checking contact details or submitting an inquiry.
Use analytics and support reports, where available, to narrow the scope. Which device group is affected? Do other pages sharing the same template have the problem? An inventory built while planning your website structure can help you select representative pages instead of testing URLs at random.
Replace “make the site faster” with an observable problem: “On mobile product pages, the price responds slowly after an option changes.” Assign someone to confirm the outcome and a developer to investigate it. Leave an unproven cause out of the task description. Whether the delay comes from the server or work in the browser is still a question to answer.
2. Separate Real-User Data from Lab Tests
PageSpeed Insights brings two kinds of evidence into one report. Its CrUX section summarizes past experiences from eligible Chrome visits. Its Lighthouse section runs a lab test under defined conditions. Historical visits and a test run today are different observations.

Check the scope before reading the result: the URL or the origin. An origin groups pages using the same scheme, hostname and port; its result is not the result for one particular page. Record the device category and collection period, too. PSI field data covers the preceding 28 days, so a change released today will not immediately replace the whole reporting window.
Missing field data is not a clean bill of health. CrUX may lack enough eligible samples. Continue investigating with lab tests, while keeping their limits visible: a controlled run does not represent your entire audience.
If field results look healthy but the lab result is weak, investigate the difference before changing settings. Devices, networks, cache state and user behavior can all affect the result. Google’s explanation of field and lab differences shows why both are useful. Field evidence helps identify the affected experience; repeatable tests help explain it.
How We Read a Test of Our Own Website
Our team ran PageSpeed Insights on Metazen’s public homepage on September 26, 2026, at 8:31 p.m. UTC+3. The mobile lab score was 91, while the field section displayed “Veri Yok,” meaning no data. That leaves us without field evidence to conclude that every visitor has a fast experience. The run used Moto G Power emulation, slow 4G throttling and Lighthouse 13.5.0 for an initial page load.
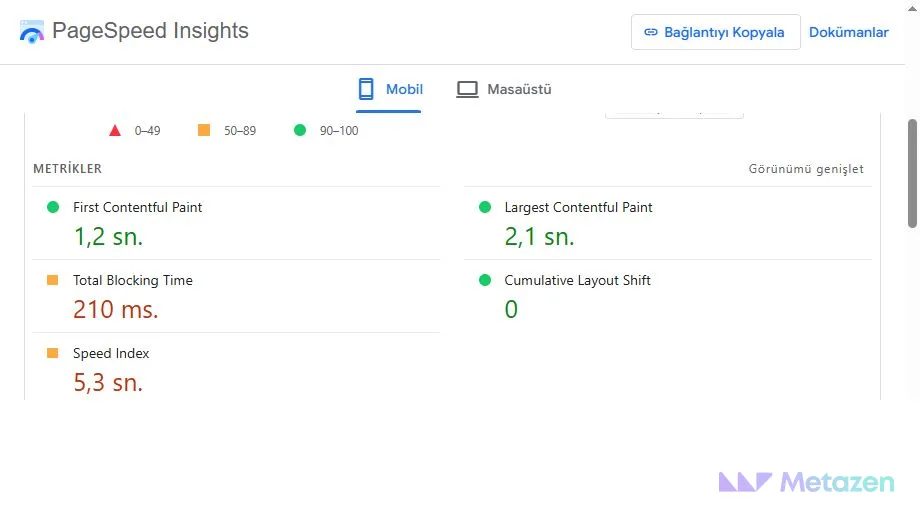
Read three values together: LCP of 2.1 seconds describes rendering the largest visible element, TBT of 210 ms reports blocking during the lab load, and CLS of 0 records layout stability in that run. The TBT result cannot establish real-user INP. Recording menu and form interactions is a useful next investigation; the green overall score alone does not close the task.
Google and PageSpeed Insights are trademarks of Google LLC. The screenshot illustrates how to read a report; it does not imply endorsement by or affiliation with Google.
3. Connect the Symptom to Its Cause
Loading delays, slow responses and shifting content call for different investigations. When a report mentions Core Web Vitals, keep three questions in view: when does the main content appear, how promptly does the page respond and do visible elements move unexpectedly?
For Late Content, Inspect the Loading Sequence
LCP tracks when the largest visible image or text block is rendered. A late product image may be discovered too late or wait on other browser work after it has downloaded. File size alone does not settle the diagnosis. Breaking LCP into its parts helps establish which delay compression would actually address. Ask the developer to identify the delayed stage, not just report a better overall score.
For a Slow Control, Record the Interaction
INP assesses responsiveness to qualifying user interactions. Open the menu, change a filter or use the form after the page has loaded. If the delay can be reproduced, a developer can record the activity in the browser’s Performance panel. Google’s INP guidance starts with identifying the affected interaction. TBT in a standard Lighthouse page-load report is a diagnostic signal, not an interchangeable INP measurement.
For Moving Content, Check What Arrives Later
A paragraph that jumps down the screen or a button that moves just before a tap can disrupt the task. CLS assesses unexpected layout shifts. Check whether space was reserved for images, ads or embedded content. Scroll through the page as well as testing its initial load. The element shown moving in a report is not necessarily the element that caused the movement.
4. Rank the Work by Impact, Reach and Evidence
Give each proposed task four short notes: the user task it affects, where it occurs, how well its cause is established and the effort or risk involved in changing it. For a widespread problem with an unknown cause, the next job may be a bounded investigation rather than an immediate fix.
Consider a hypothetical product website that collects quote requests. The following findings are illustrative, not client results. Their order depends on the evidence and the visitor’s task, rather than the number of red warnings.
| Finding | First Action |
|---|---|
| Product options respond slowly across mobile pages; an interaction trace identifies the cause. | Address the confirmed delay first, then check that options and prices still behave correctly in the same journey. |
| Main content appears late across service pages, but the cause is unknown. | Investigate loading on representative pages using the shared template before replacing every image. |
| A rarely visited archive page has a low score in one lab run. | Repeat the test and establish its scope before opening a large remediation task. |
Low traffic does not automatically mean low priority. A quote or payment step may serve fewer visits while carrying a critical task. A small code change can carry dependencies, too: deferring a shared script might affect navigation, forms or consent choices. Have the owner record the expected benefit and rollback approach before implementation.
Do not remove a necessary feature just to improve a score. A visible form does not prove submission works, and a responding button does not prove the transaction finishes. Verify the relevant function alongside the speed change.
5. Verify Changes Under Comparable Conditions
Keep the URL, device profile, network conditions, cache state and user steps consistent before and after a change. Review repeated tests together rather than selecting one favorable run. Record the release version, date, target metric and observed outcome. Note any other change between the measurements that could affect the comparison.
For the product-option example, an improved overall score is not enough. Confirm that the response changed, the correct price appears and the form still works. Then follow the experience in field data. A new campaign image, tracking script or template update can undo earlier progress, so monitoring should continue after release.
Keep search expectations in proportion. Google explains that good Core Web Vitals do not guarantee top rankings. Performance supports the technical and content work involved in SEO; it does not replace relevant information or a usable site structure.
Plan Your Performance Improvements with Our Team
If you have a speed report but no clear implementation order, we can examine the affected pages and journeys with you. At Metazen, we assess loading, responsiveness and visual stability alongside the functions the site needs to deliver. Meet our web and software team and explore how testing and improvements fit into our web design service. Bring an example page and the action that feels slow to give the discussion a concrete starting point.

